Understanding Carbon Inventories: Measuring the Climate Value of Our Landscapes
By: Logan Steeves & Nigel McLaughlin
As climate change continues to shape how we think about land use, conservation, and forest management, understanding how much carbon our landscapes store has never been more important. One of the key tools we use to do this is a carbon inventory. At the Fundy Biosphere Region, carbon inventories help us better understand the role our forests play in climate mitigation and guide informed conservation and management decisions.
What is a Carbon Inventory & why are they important?
A carbon inventory is a systematic assessment of the amount of carbon stored in a landscape. This includes carbon held in live trees, by collecting detailed field measurements, carbon inventories provide a snapshot of how much carbon is currently stored on a site and help estimate its potential to store more over time.
Performing carbon inventories pulls any assumptions on a landscape out of the equation. Two sites of similar size may have similar carbon storage capacity, but other times a smaller site could hold more carbon than a much larger site. Species composition, tree density (Trees per Hectare), age and site conditions are the main contributors to carbon storage. Site size is not an accurate measurement of carbon storage. 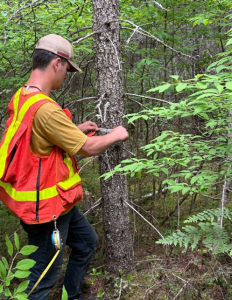
By collecting site-specific data, carbon inventories help to:
- Identify high-value carbon storage areas
- Support land protection and conservation prioritization
- Inform forest and land management decisions
- Provide baseline data for future monitoring and reporting
Ultimately, carbon inventories are the baseline to presenting carbon in a transparent way. It allows us to highlight climate benefits, compare across the landscape, measure and monitor to ensure the best knowledge on carbon storage/sequestration.
How Fundy Biosphere Region Conducts Carbon Inventories:
Our carbon inventories combine desktop analysis with on-the-ground field assessments. Before visiting a site, we review existing aerial imagery. This helps us understand site conditions and plan efficient fieldwork. We then make a GIS map outlining the site with a grid then sample plots. As a rule, the Fundy Biosphere aims for a 1% sample intensity, meaning that the total area of the plots works out to approximately 1% of the total site area.
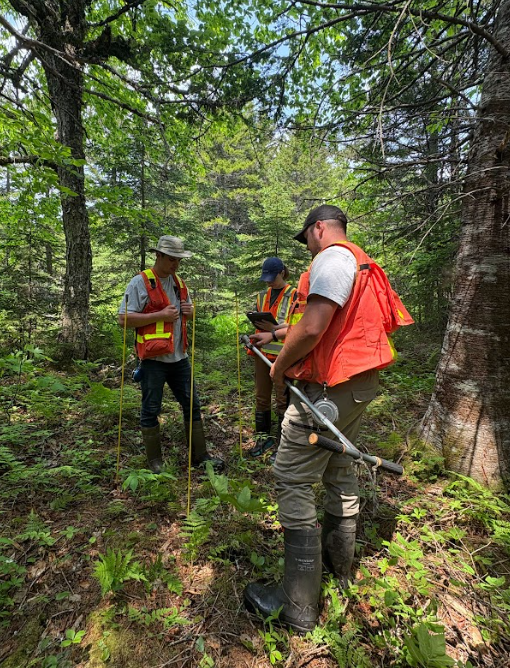
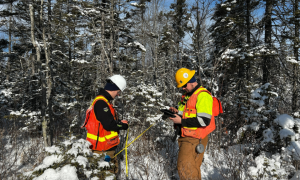
Once desktop work is completed, we use Avenza Maps to navigate to sample plots and collect measurements including:
- Tree species and diameter
- Tree height and stand density
- Standing deadwood for wildlife habitat density not carbon based
- Site conditions and limitations
Once the site has been all accounted for these measurements are then used in standardized carbon accounting methods to estimate total carbon storage and sequestration potential for each site.
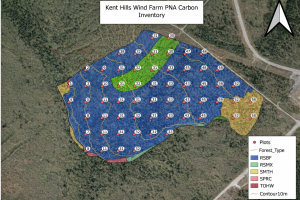
Figure 1: . Carbon Inventory map for one of this summer’s inventories displaying ariel imagery, species composition, contours, and survey plots.
Fundy Biosphere’s accomplishments so far:
Since the project’s inception, Fundy Biosphere staff have completed 18 carbon inventories: 10 in 2024 and 8 in 2025. We aim to complete another 10 for 2026. Each carbon inventory took place within the Fundy Biosphere across varying land types and ownership such as, Composing Crown Land, Protected Natural Areas (PNA’s), and private land.
This summer, we surveyed carbon storage on 8 sites, for a total area of 650 hectares at 1% intensity (when summed, the areas of all plots collectively account for 1% of the total site area). Our plots alone covered 6.5 hectares of sampling, and within that 6.5 hectares, accounted for 1,874,102.25 kg of carbon.
The data we collect directly supports ongoing conservation initiatives, ecological corridor planning, and climate-focused land management throughout the Fundy Biosphere Region.
Looking ahead:
 Carbon within a forest isn’t fixed, it fluctuates over time. Factors influencing carbon storage are timber harvesting, disease outbreaks, stands that are aging out, or stands that are regenerating after a disturbance. Sometimes it increases, sometimes it decreases. By continuing to expand and revisit our carbon inventory work, we can track these changes over time and ensure that conservation actions deliver meaningful, long-term climate benefits.
This work is possible thanks to funding support from Parks Canada’s National Program for Ecological Corridors, NB Environmental Trust Fund, and Environment and Climate Change Canada.
To learn more about how carbon inventories are being applied across Fundy Biosphere Region, and how this work supports conservation, climate planning, and long-term land stewardship, follow along on our blog and social media